Maps can represent reality and can contest it. How can we learn to see the lines of power that they encode?
One early morning in March 1819, at the first break of dawn, a small group of Beothuk—the indigenous inhabitants of the island now more commonly known as Newfoundland—were at their winter camp on the north side of Beothuk Lake, a long and narrow body of water at the island's center, when they were awakened by the sound of intruders. A group of British settlers had surrounded their camp. While the settlers' intentions were not yet known, the Beothuk had cause for alarm. Every previous encounter with the British had ended in destruction and death. This encounter would soon result in the same.
The Beothuk had been navigating their relationships with Europeans for centuries. Some speculate that the Icelandic Sagas' mention of “Skraelings” refers to ancestors of the Beothuk, which would date a first encounter to the eleventh century. A second phase of more sustained relation began shortly after the Italian explorer John Cabot's initial visit to the island, in 1497, and persisted for over two hundred years. During this time, “fishing crews from Spain, Portugal, France, and Britain would spend the summer months catching and processing cod before returning home for the winter,” as environmental humanities scholar Fiona Polack explains. These seasonal incursions granted the Beothuk “periods of unimpeded access to valuable materials, such as metal objects left in unattended fishing stations, and reduced the need for them to interact directly with the invaders.” Polack also documents how this arrangement—to which, of course, the Beothuk had no choice but to consent—began to strain as “increasing numbers of people from the British isles began to settle permanently on the island and compete directly with the Beothuk for resources.” It was this competition for resources, compounded over centuries, that in no small part led the British to Beothuk Lake that day.
But there were other, more direct motivations: several months earlier, on September 18th, 1818, it was a group of Beothuk who had surprised the same British settlers as they were preparing for a trip to market. Hidden in a canoe under a wharf at Lower Sandy Point, in the Bay of Exploits—north and east of Beothuk Lake, where its waters met up with the sea—the Beothuk waited for the “dense darkness” of night and then absconded with a boat carrying the season's catch of salmon, and possibly some furs. This “theft and act of destruction” provided the rationale for John Peyton Jr., the owner of the boat, whose personal narrative serves as the source of the direct quotations here, to request formal authorization from the governor of colonial Newfoundland to “search for his stolen property and, if possible, try and capture one of the Indians alive.”
The Beothuk group did not know about the kidnapping authorization when they awoke that morning in March. But within minutes, the settlers' goal became clear. When the Beothuk fled to the woods, one woman, Demasduit, fell behind and was immediately set upon by the British. She “pointed out to the white men her full breasts to show that she had a child, and pointed up to the heavens to implore them, in God's mercy, to allow her to return to her child,” but they “took hold of her,” recalled John Paul, a Mi'kmaq-Innu man whose grandfather had been alive (but not present) at the time of the original events. Demasduit's partner, a man named Nonosabasut, “came to her aid,” but Peyton shot and killed him. Two days later, the child of Demasduit and Nonosabasut died as well—likely the result of starvation. One other young woman, Shanawdithit, who was then around seventeen, bore witness to it all.
Shanawdithit's hand-drawn maps, which we first encountered in this project's Introduction, as we will now learn document these events in visual form. But the story that we tell about them here is not offered in the service of an argument about the utility of Beothuk mapping techniques for the field of data visualization, or an analysis of the additional insight about the data that the maps prompt. Rather, the story we present in this chapter is about the colonial context that gave rise to their creation, and about how that context—what we call here the colonial frame—must be considered alongside any knowledge that the maps themselves bring to light.
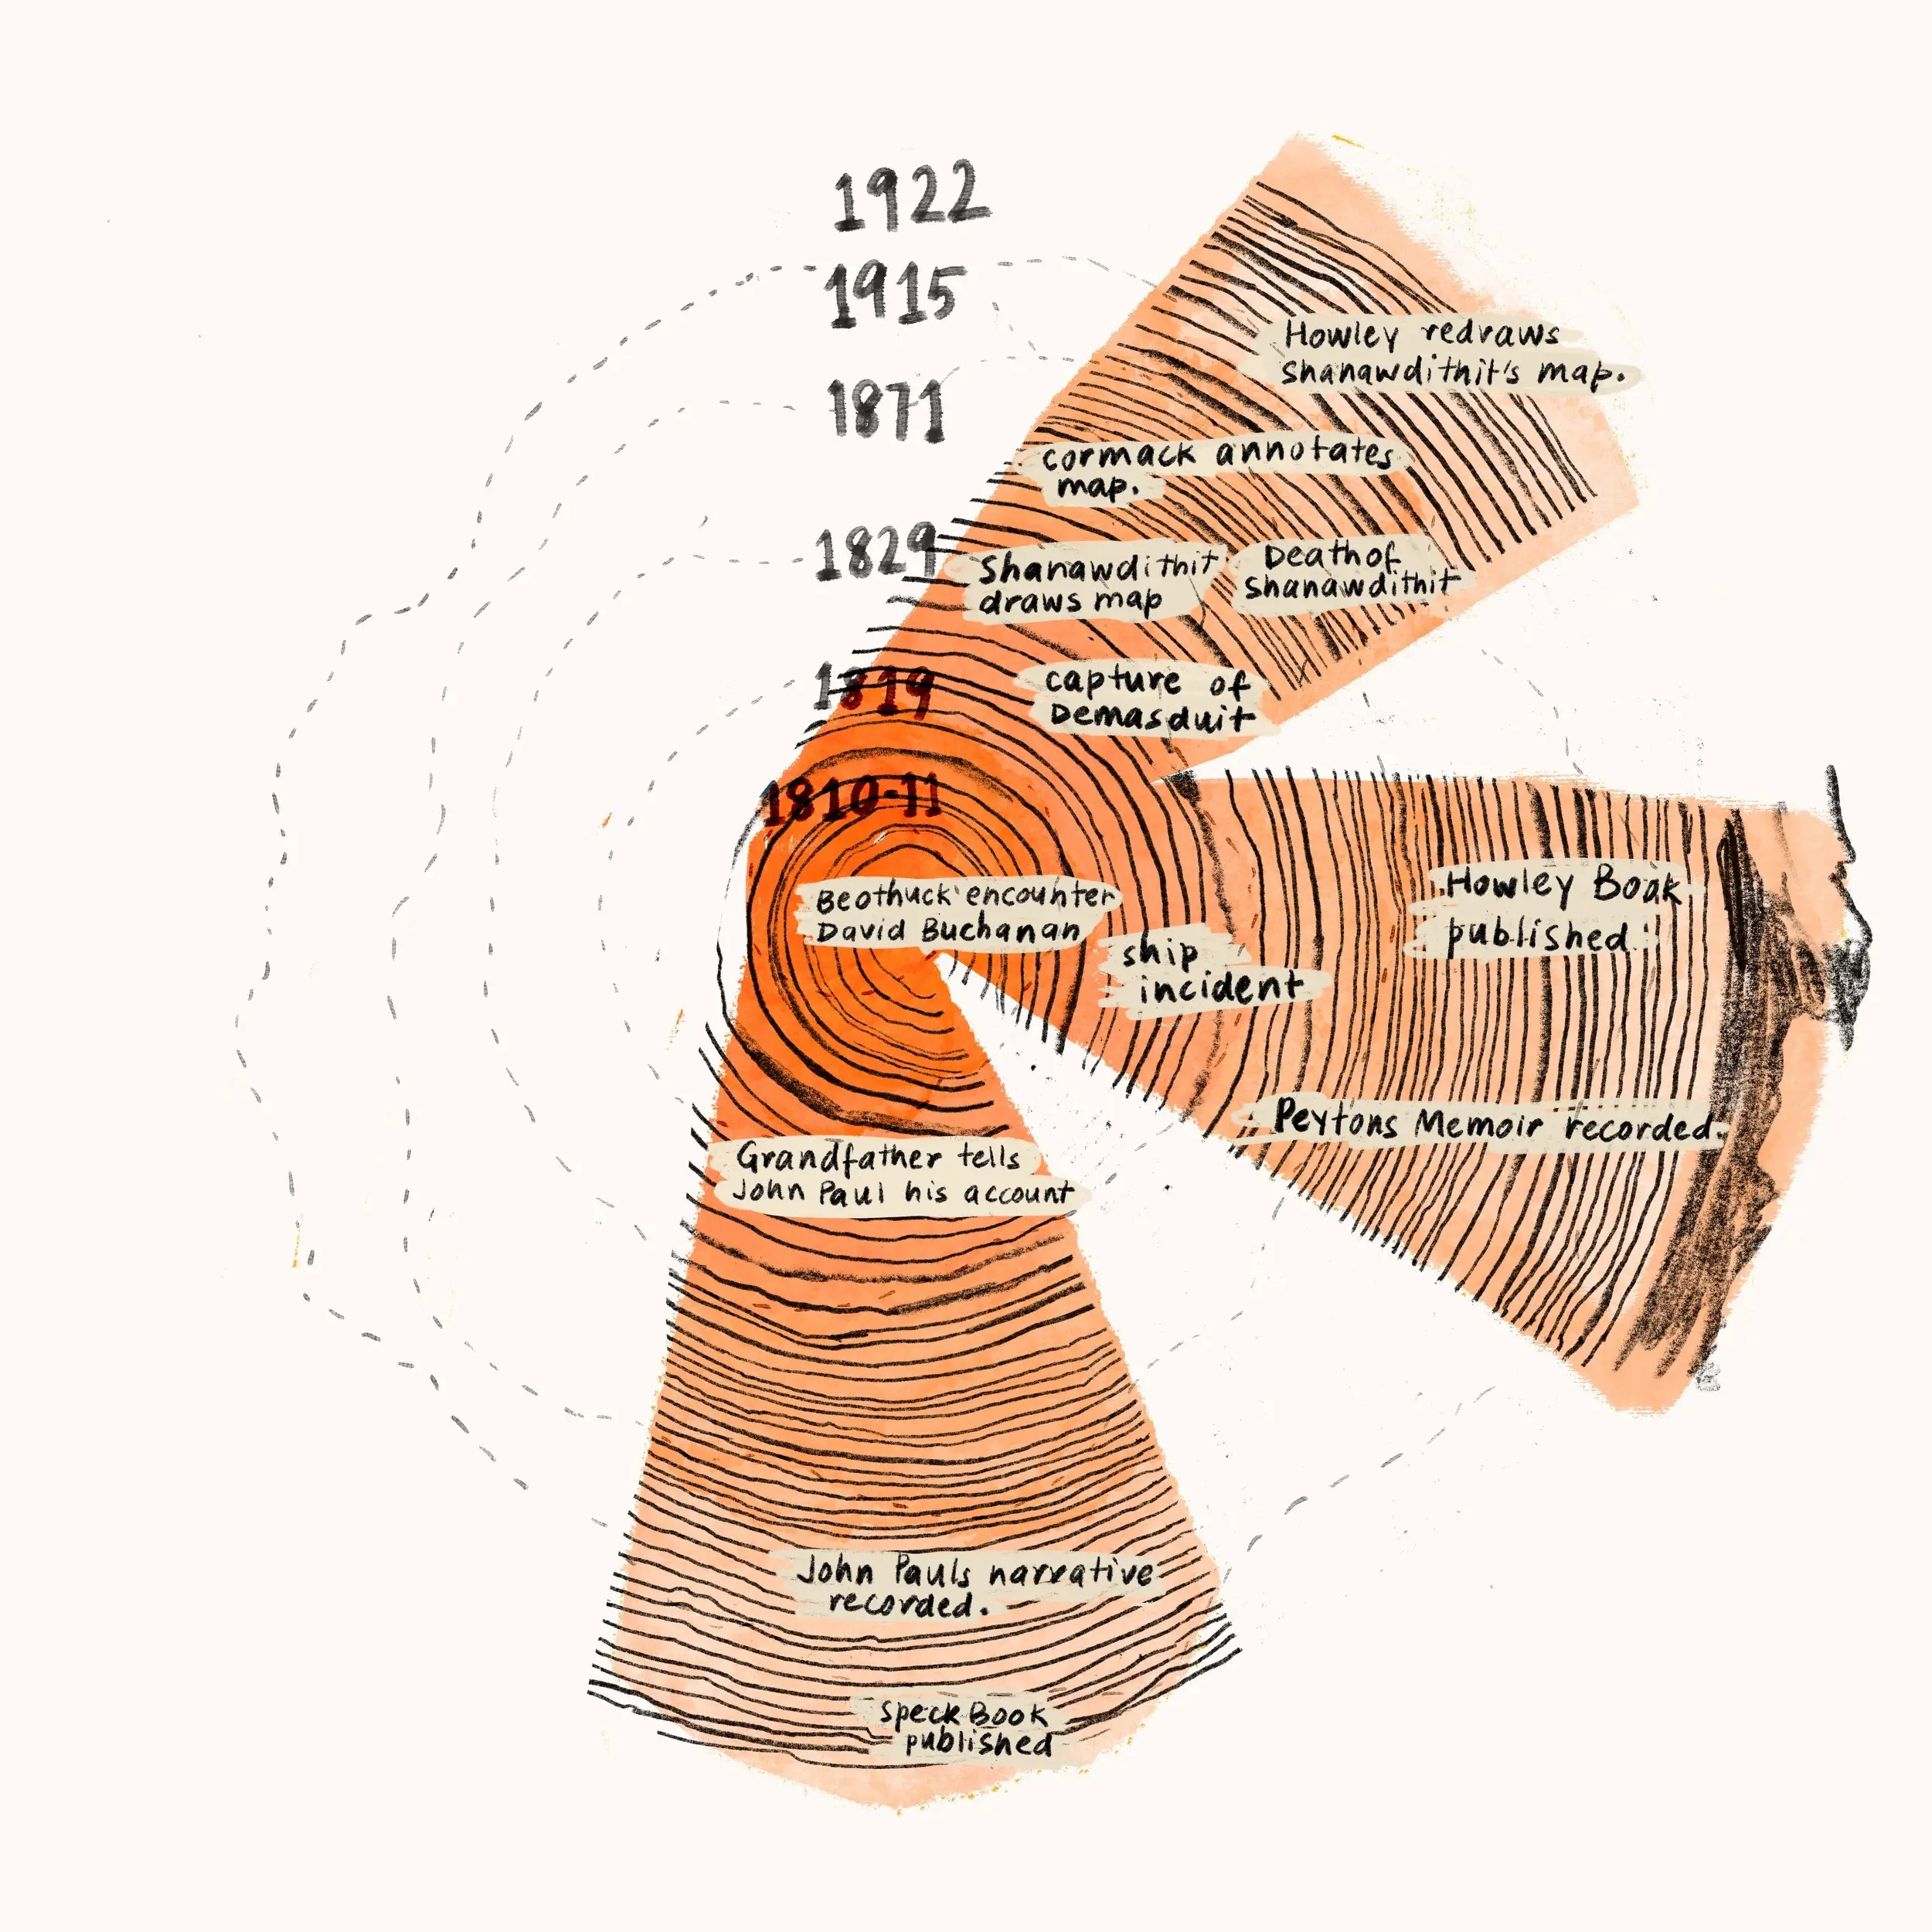
The diagram above attempts to give this colonial frame visual presence, accentuating the three primary sources that allow us, today, to learn about the events that led to the maps' creation. Our choice of focus on the frame is intentional. At various points in this project—in the Introduction, for example, and in our visualization of the Trans-Atlantic Slave Trade data that appears in Chapter 1—we have been explicit about acknowledging the positions from which our work has taken place. Here is another moment where these positions matter, since research involving sources that document Indigenous cultures must always be informed by the relationships among those sources, the researchers, and the cultures they seek to study. As a group of (mostly) settler researchers, our relationships to the Beothuk and the sources that document their culture is itself a colonial one. As such, we see our role—indeed, our responsibility—as one of illuminating the role of Shanawdithit and the place of her maps in the long history of extracting Indigenous knowledge for colonial gain.
This history is a violent one, as you have already begun to learn. The additional details about Shanawdithit and her maps that follow, which involve yet more instances of violence and harm, underscore how the maps at the center of this chapter cannot be separated from the inherent violence of colonialism. This is an important lesson for readers who have not yet considered the colonial context that frames so much of the history of data visualization. But there is a second lesson of this chapter, one more conceptual but no less profound, about how our present view of the value of data visualization—that is, its ability to distill insight from complex data such that knowledge can easily and efficiently emerge—sits uneasily close to that constitutive practice of colonial power: of extracting knowledge from its source.
As at previous moments in this project that have brought us to uncomfortable points, the response to this assertion is, we hope, not to close this browser tab and walk away. Rather, we hope it will serve as an invitation to consider how we might design future data visualizations, as well as reposition ourselves with respect to existing ones, in ways that enable the creation of knowledge in less extractive modes. This consideration entails an attention to the lives behind the data, as we have explored in Chapter 1, as well as to the forms of insight that visualizations are most often designed to promote, as Chapter 2 helps to explain. But the colonial frame that surrounds Shanawdithit's maps enables us to see yet more: our own relationships with the people who provide us with data, and those represented in it, as well as our responsibilities towards the knowledge that we together create.
With the importance of relationships and responsibility in mind, we now return to the story of Shanawdithit's maps as it emerges from the colonial archive. As it turns out, this story passes directly through Demasduit and her own eventual fate. Demasduit was taken first to the fishing village of Twillingate and then in the spring, after the ice had cleared, to the colony of St. John's. She made several attempts to escape her captors. At some point during this time, she contracted tuberculosis. She succumbed to the disease less than a year later, while aboard a boat that was intended to return her to her family, the British having achieved a deadly version of their goal of retribution.
Shanawdithit was present the day that Demasduit's body was returned to Beothuk Lake, and she participated in Demasduit's burial ceremony, held over the course of several months the next spring. But the British would not learn of Shanawdithit until four years later, in April 1823, when Shanawdithit was herself captured, along with her mother and her sister. The three women had been heading “to the seacoast in search of mussels to subsist on,” following another winter in which food had been scarce and illness had been plentiful. A different group of British settlers—furriers, this time—came across them. Concluding that it had become too difficult to continue to keep themselves alive, according to another British account, Shanawdithit and her kin “allowed themselves in despair to be quietly captured.”
Like Demsaduit before them, the three women were taken to Twillingate, where they were held captive in the home of none other than John Peyton Jr. Shanawdithit's mother and sister soon died, also of tuberculosis. But Shanawdithit persevered. For five years, she was forced to work for Peyton as a domestic servant, before she too fell ill. Following Demasduit's final path, Shanawdithit was then brought to St. John's, where she spent six of the final weeks of her life in the home of William Epps Cormack. Cormack, the Newfoundland-born son of Scottish settlers who'd earned early fame as for his natural history of the island's interior, was the one to supply Shanawdithit with “paper and pencils of various colours,” and who through some combination of enticement or coercion—we can never know—prompted her to create her maps.
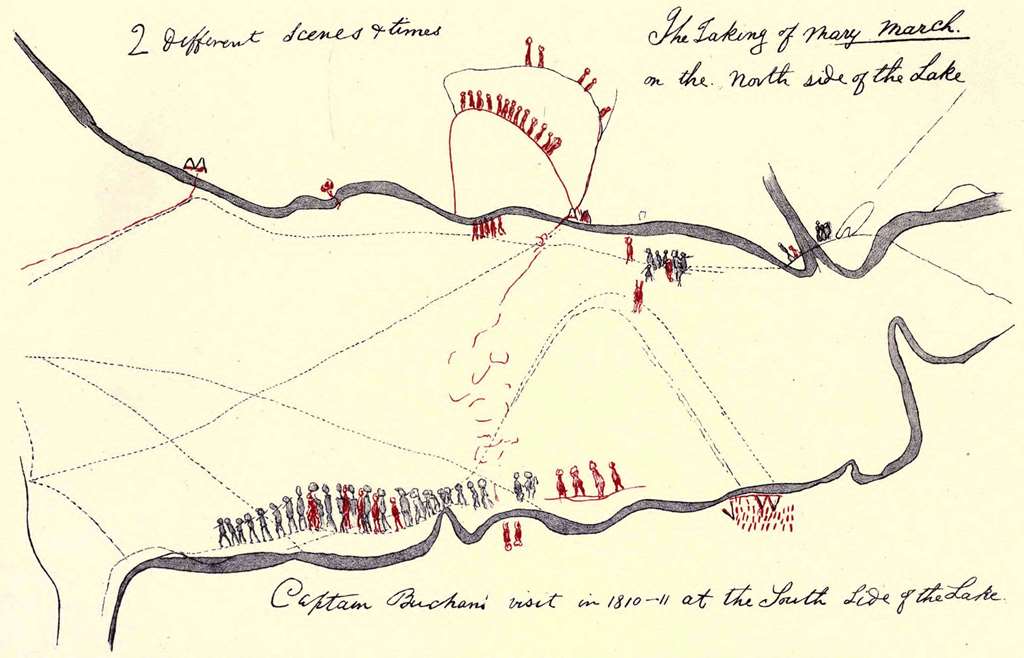
This map, known as “Drawing II,” is second in a sequence of five maps and five additional drawings. It presents a syncretic picture of the series of encounters between the Beothuk and the British that culminated in Demasduit's capture and eventual death. While the events that Shanawdithit depicts span decades, the five maps all center on Beothuk Lake. Time is anchored by place.
The lower half of the map depicts an earlier encounter between the two groups, which took place on the south side of the lake in the winter of 1810-11. Twenty or so figures appear along the bank of the river. The figures drawn in red are Beothuk. Those in black are the members of the British party, led by a Scottish naval officer named David Buchan. They are pictured after their initial meeting, which was enabled by Mi'kmaq and Innu guides.
The group of figures set to the right of the larger group—two black figures and four red ones—likely stand for the two marines and four Beothuk whose distrust of the settlers—the result of several prior instances of kidnapping and murder-would result in the preemptive killing of the two marines the next day. The two red figures oriented in the opposite direction may be the two Beothuk who briefly traveled with the British back to their camp before they were “told by signals to give chase,” as John Paul reports.
Off to the east—the right side of the page—is the Beothuk winter camp. Three triangles stand for the three dwellings, called mamateeks, which housed the group. Thirty-seven marks stand for each of the 37 inhabitants in the winter camp that year.
The dotted lines on the map correspond to paths taken across the frozen lake during the years that the map depicts. The lines thus connect the series of events depicted, as well as the two sides of the lake.
On the north side we also see several mamateeks—two drawn in red at the center of the shoreline, and a third drawn in black just off to the east. The black color and rectangular shape indicates that it is covered in the sail that was stolen from Peyton's boat, in the episode described at the outset of this chapter.
A second set of mamateeks are positioned to the west of the winter camp; these may be the two mamateeks to which the Beothuk fled after the deadly encounter with Buchan's men, but this is not certain.
As for Demasduit's capture, we see several phases of the events superimposed. Viewed chronologically, we first see several settlers to the east, drawn in black, whom we can infer from Peyton's narrative, and which Shanawdithit confirms, are some of Peyton's men who have hidden themselves in order to surveil the Beothuk camp before their morning attack.
In the center of the map we see several groups of red figures pictured along various footpaths; these, we might conclude, are the inhabitants of the winter camp who sought safety in the woods upon being attacked.
On the frozen lake is another group of figures. The main cluster is composed of six figures in black and one in red, presumably Demasduit in the initial moment of capture. To the left of that group is a large red figure, likely Nonosabasut depicted in the act of defending his wife. Just south of the group is another red figure on the ground. While Cormack claims that this figure represents Nonosabasut after being shot and killed, Shanawdithit insists that two men were killed that day—the second being Nonosabasut’s brother, who also came to Demasduit’s aid.
Positioned between this tragic scene and the initial surveillance of the Beothuk camp is a pair of figures, one red and one black, which has been interpreted as Demasduit and one of her captors—perhaps Peyton himself. The man is leading her away from the home that she would never again visit alive.
Already, the inextricability of the maps' creation from the larger colonial project should be quite clear. But Cormack's own words lay the extractive nature of this project bare: “I keep her pretty busily employed in drawing historical representations of everything that suggests itself relating to her tribe, which I find is the best and readiest way of gathering information from her,” as he wrote in a letter to the Bishop of Nova Scotia in January 1829. Cormack's sense of entitlement to Shanawdihit's knowledge is here apparent.
Cormack's entitlement is also documented on the map in the form of the textual annotations, which were penned not by Shanawdithit but by Cormack himself, likely at the same time that Shanawdithit set her own lines to the page. Cormack's handwriting encircles Shanawdithit's image, registering the “information” he sought to extract from her and even more: the power that he held over her as her captor, power that also colors the information presented on the map.
But Cormack's direct extraction of Shanawdithit's knowledge was only one layer of how her maps have been mined for information over time. In the early twentieth century, a British government official and geographer named James P. Howley redrew Shanawdithit's maps for inclusion his own book, The Beothucks or Red Indians , which is also the first place that Peyton's narrative appears. In addition to certain aesthetic decisions, such as smoothing out Shanawdithit's shading of the riverbanks, which had the effect of erasing the individual pencil strokes that more directly link Shanawdithit to the creation of her map, Howley also edited and re-wrote Cormack's annotations, removing the erroneous words that Cormack first recorded and then crossed out. This editorial decision underscores Howley's own sense of entitlement to Shanawdithit's knowledge, and his view of it as ethnographic information that could be easily severed from its source.
While we made the decision not to convert this information into GIS data and plot it on a map of our own, we are still also actors in this extractive process. For as much as we have sought to keep our emphasis on the map's colonial frame, rather than the “information” about the Beothuk that it contains, our model of interactive explanation—the same we use to structure the start of each chapter of this book—reflects an uncomfortably similar approach to the one that Cormack and Howley both employed: of atomizing the image and clarifying the significance of its various parts. In the present, we still presume that the goal of visualization should be to clarify, and to enable deeper exploration if required. We do not often consider how the process of clarifying the significance of the data runs the risk of further distancing the data from those who created it, or how enabling deeper exploration very often involves the transfer of explanatory power from those who created (or are represented in) the original data—or in this case, the original image—to ourselves.
Centuries of experiencing the effects of knowledge extraction, as well as of the blatant disregard for responsibility or relation, have motivated Indigenous scholars to develop principles for maintaining Indigenous data sovereignty and governance. These principles elevate the goal of collective benefit, as well as considerations of responsibility and ethics, as well as access and control. Here we begin to see how similar principles might be applied to visualization, since the process of extracting knowledge from those who originally possess it is not limited to the collection phase of the data analysis “pipeline” alone.
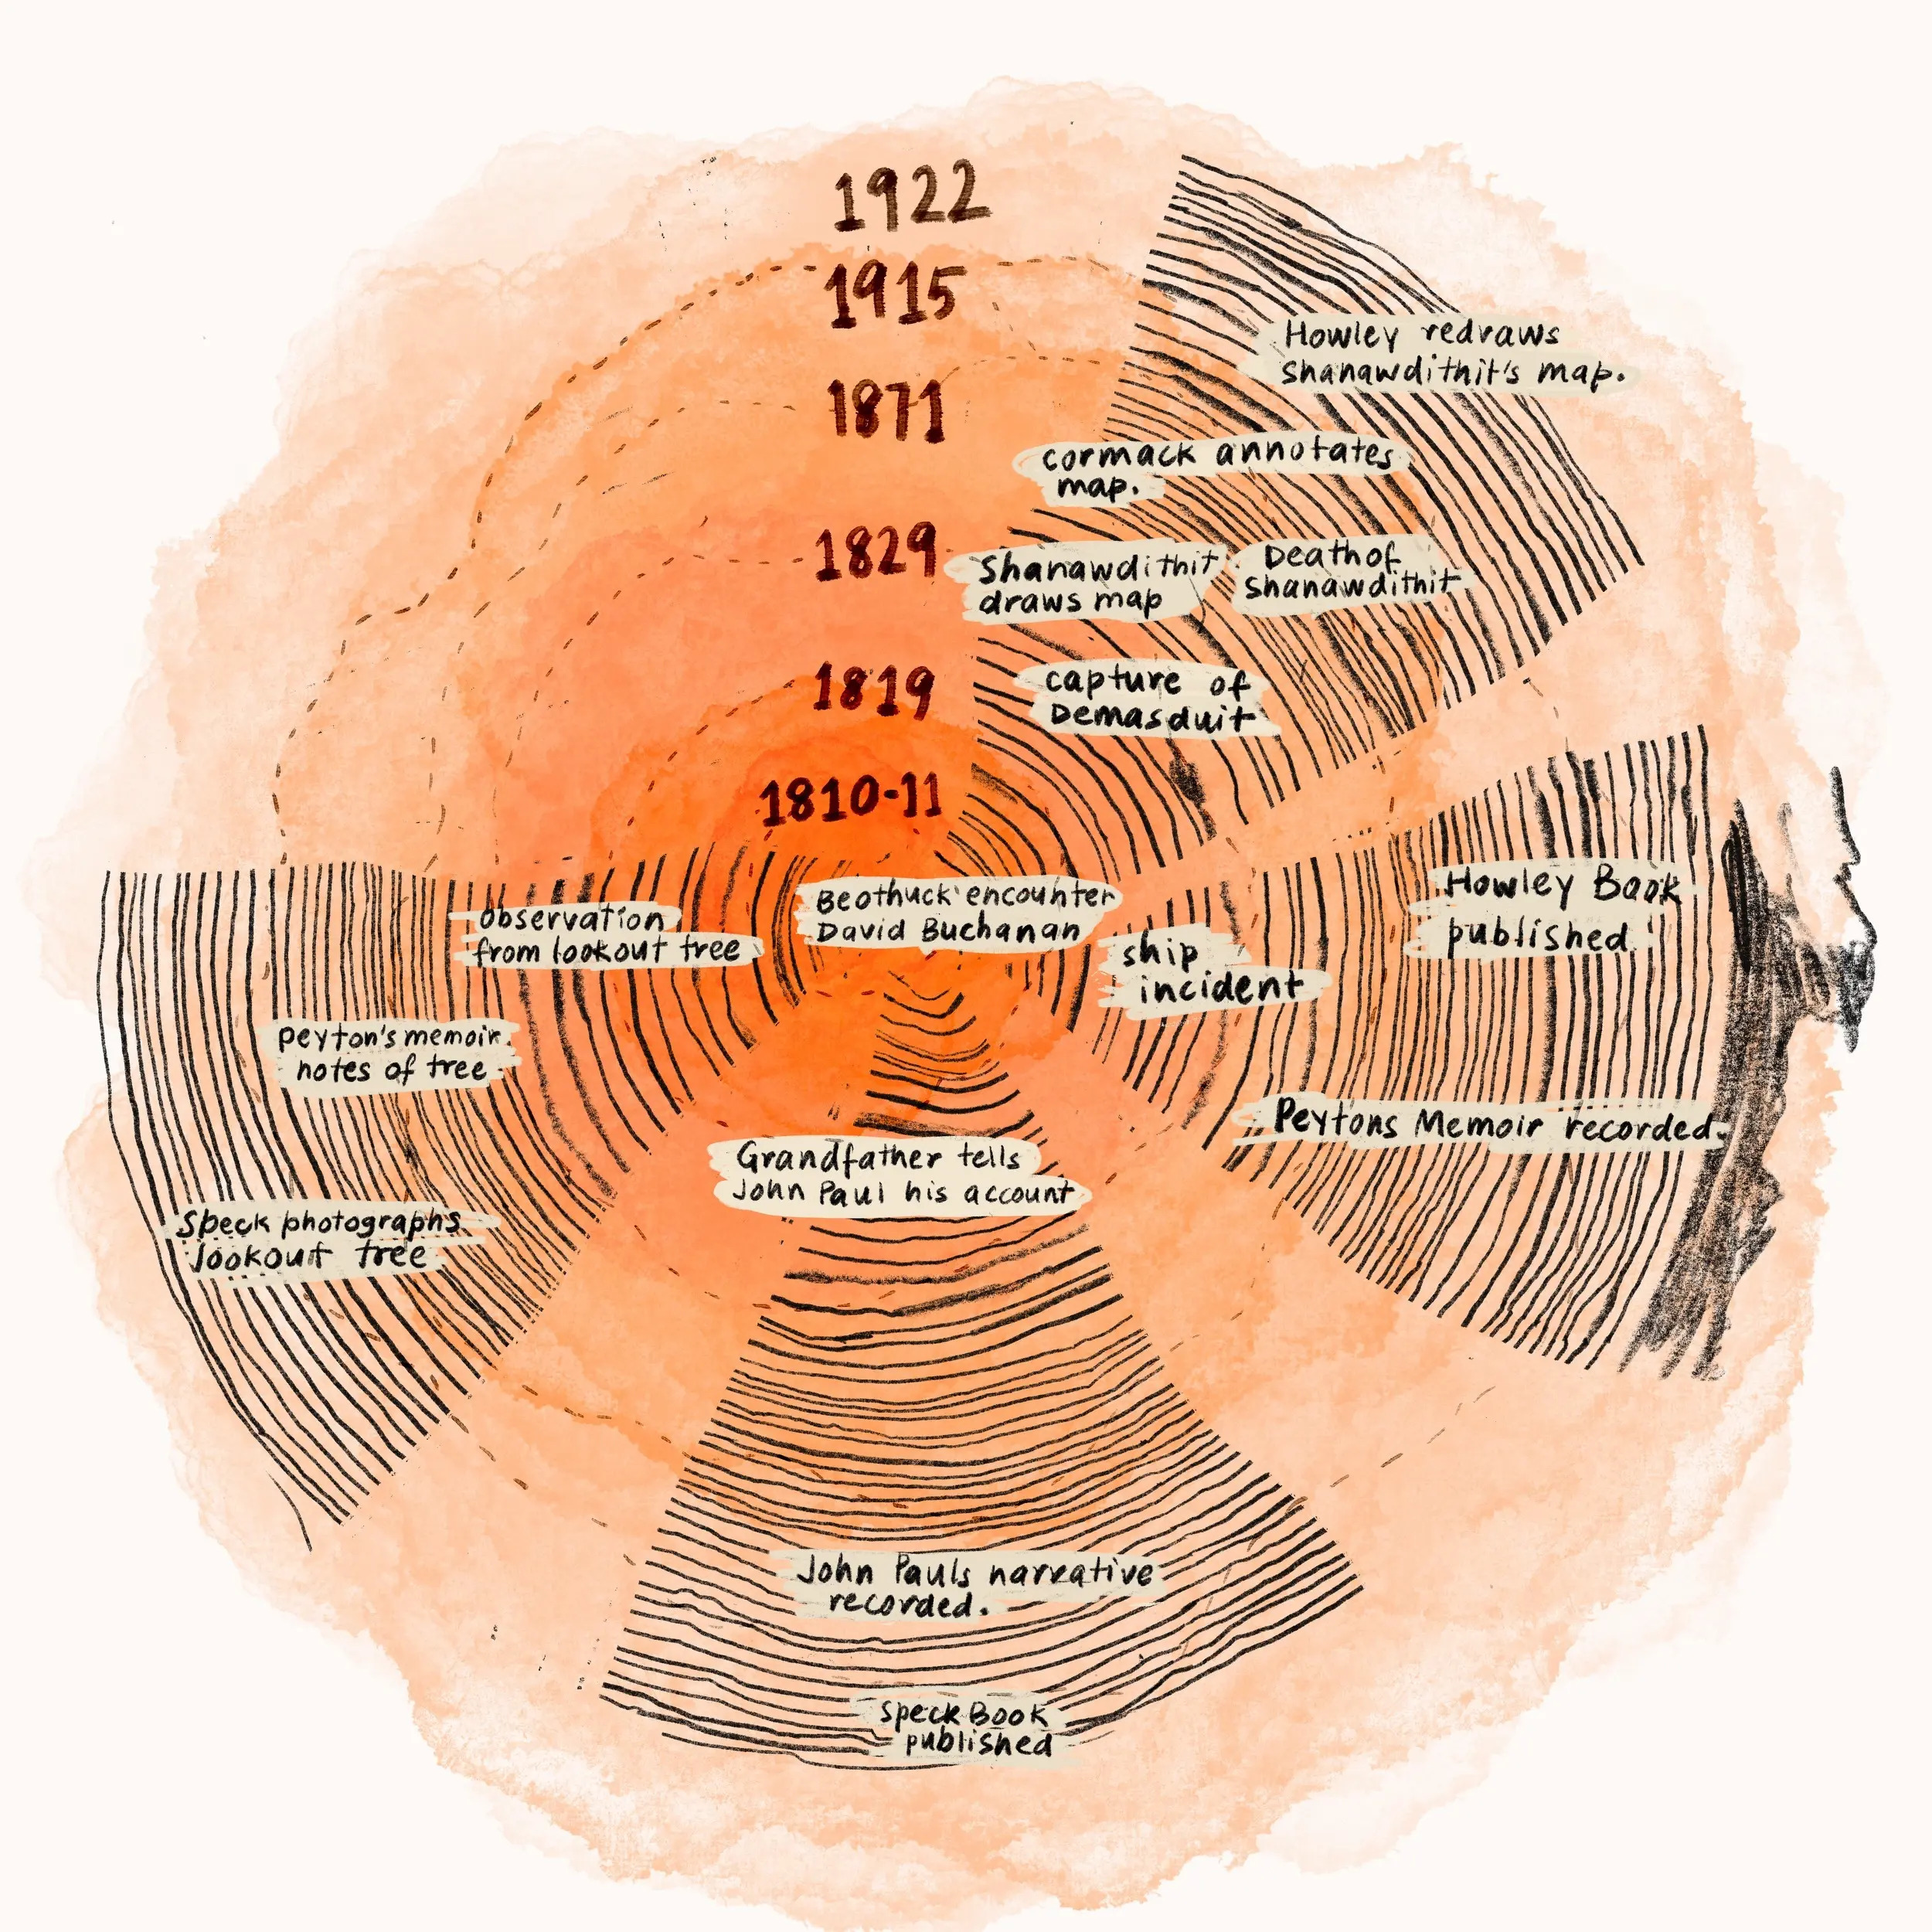
Adding Cormack and Howley, along with ourselves, to our diagram of sources accentuates the layers of mediation that separate us from the original image, as they do from Shanawdithit's first-hand knowledge of the original events. This direct knowledge is irrecoverable—and even if we could approximate it, the principles of Indigenous data sovereignty tell us that it is not ours to own. But the visual evidence of this irrecoverability can, we hope, also be a source of broader insight, as well as a guide for future visualization work. As visualization designers, we cannot change our reliance on data; it is the substrate of all the work that we do, as Chapter 2 has explored. But what we can change is our awareness of our position with respect to our data, and to the visualizations that we create. When we enter into a visualization project without sufficient regard for the data's provenance, we often fail to recognize what knowledge may have already been lost in the process of separating that data from its source. It also becomes all the more difficult to consider any responsibilities we might have to the people who created the data, the people whose data our visualizations represents, and the people who view or interact with our visualizations in their final form.
The circumstances that surround the creation of Shanawdithit's map make it clear that we cannot view it as an unmediated expression of her worldview. And yet, it is also clear that, despite Shanawdithit's captivity, and Comack's role in prompting the creation of the map, Shanawdithit was able to incorporate many of her own ideas into the map's design with respect to both content and form, in the sense that many of Shanawdithit's design decisions appear to be informed by elements of Indigenous mapmaking practice. These elements are useful to unpack for how they help to attune us—if not to grant full access—to ways of knowing outside of the colonial frame.
The idea of "Indigenous mapmaking practice" is of course loose term, spanning cultures and continents, medium and genre, as critical cartographer Margaret Pearce (Potawatomi) explains. In her summation of these practices, Pearce invokes examples that range from "Hawaiian performative cartographies to Navajo verbal maps and sand paintings and the Nuwuvi Salt Song Trail," emphasizing how Indigenous maps may be "gestural, chanted, or inscribed in stone, wood, wall, tattoo, leaf, or paper," and may be enlisted to a variety of ends: "to assess taxes, guide a pilgrim, connect the realms of the sacred and profane, or navigate beyond the horizon." What binds these examples together, for Pearce, as for other scholars of Indigenous cartography, is how they are understood as part of a larger process of knowledge-making, rather than as a definitive source of what isthere. This process is premised on relationships among people as well as places, relationships that continue to acquire meaning as they unfold.
The relational basis of Indigenous mapmaking is most directly expressed in how such maps express temporal rather than spatial points of view. We see this foregrounding of a temporal perspective emerge in Shanawdithit's decision to depict a series of events, which transpired over decades, in the single place of Beothuk Lake. In Cormack's difficulty in determining what it was, precisely, that Shanawdithit had pictured on the page, we can also perceive its divergence from the spatial perspective that was (and remains) characteristic of colonial maps. Cormack crosses out one of his earlier incorrect labels, “The Taking of Mary March,” which he had first positioned on the south side of the lake, and rewrites in a more accurate location on the north side. He also adds in a clarifying note at the top left of the map, just below the reference number he has provided: “2 different Scenes & times.” The note is underlined for emphasis. It appears that Cormack himself requires this note in order to remind himself of what was depicted, even as the link between the two scenes was (presumably) self-evident in Shanawdithit's mind.
Another indicator of how Shanawdithit understood her map as only one piece of a larger system can be seen her decision to include human figures on her map. This exemplifies what Pearce characterizes as an emphasis on place as it is experienced, “as opposed to the Western convention of depicting space as universal, homogenized, and devoid of human experience.” This is what geographer Laura Harjo (Mvskoke) has theorized with respect to Mvskoke conceptions of space as a “kin-space-time lens,” which she similarly contrasts with “Cartesian mapping.” In his analysis of Shanawdithit's maps, geographer Matthew Sparke observes something similar, noting how even the symbolic components of the map, such as the paths across the lake, push back against Western orthodoxies of space and scale. By depicting “the uneven possibilities of travel by foot across uneven landscape,” he suggests, Shanawdithit incorporates an embodied dimension into the elements of the map that would otherwise be interpreted only for the geographical information that they convey. More pointedly, as Fiona Polack observes, Shanawdithit's maps make it impossible for their viewers to conceive of the land without the people—the Beothuk—who had first inhabited it.
Before moving forward, there are several additional features of the map that are important to underscore. First, it is incredibly accurate; Howley is among several settlers who comment on the maps' “extraordinary minuteness of topographical detail.” Second, Shanawdithit was not simply drawing her land and her people; she was actually drawing herself. Shanawdithit appears on the map in multiple places and in multiple forms: as one of the thirty-seven tick marks on the south side of the lake, and again on the north side as one of the figures in red that sought shelter in the woods. While she may have been recording “information” about her people for Cormack, to return to his words, she was also testifying to the events of her own life. It follows, then, that there is also an interpretation of the map as evidence of Shanawdithit's “survivance,” to enlist a term coined by Chippewa scholar Gerald Vizenor, which he intends to emphasize how, in the continued unfolding of colonial violence, survival constitutes an act of resistance in and of itself.
With that said, the violence that surrounds the creation of the map—the same violence that it records—ensures that it can never be upheld as an example of triumph alone. For even if it epitomizes a “kin-space-time lens,” it also vivifies the violence that is the reason it was even set to the page. An additional biographical detail underscores this point. The art historian Nicholas Chare, who has written on Shanawdithit's maps through the lens of trauma studies, locates in a note written by Cormack the otherwise unremarked upon fact that Shanawdithit “received two gunshot wounds at two different times, from shots fired at the band she was with by the English people at Exploits,” and that “one wound was that [of] a slug or buck shot thro[ugh] the palm of her hand.” While it is unknown which hand Shanawdithit employed to draw her sketches, “it may well have been the hand she sketched with,” Chare suggests. Regardless, the wound and the scar it left on her skin—one which Cormack reports that he saw—serves as a visceral reminder of how Shanawdithit's maps were a direct output of colonial violence, the very same that led to the destruction of her culture and the death of her Beothuk kin.
By excavating the layers of knowledge extraction, and outright violence, that surround Shanawdithit's creation of her map, we are further guided by the approach of literary scholar Mishuana Goeman (Seneca), who emphasizes the importance of “examining the theoretical dimensions of power” so as to resist the “utopian” yet ultimately impossible goal of recovery. No magnitude of desire or strength of effort, as Goeman explains, can gain us access to “an original and pure point in history,” nor can we ever fully account for colonialism's ongoing effects. The most generative form of knowledge we might pursue, Goeman suggests, and which this chapter sets as its goal, is an understanding of “the relationships set forth during colonialism that continue to mark us today.”
Goeman's point of departure, like ours, is the map, because of how closely maps and mapping are tied to the production of colonial power. Maps can literally create nations and dismantle others—a lesson that most Indigenous inhabitants of Turtle Island had learned well before the encounter between the Beothuk and Peyton and his men. Consider the example of the so-called “Walking Purchase,” which dates to 1737, nearly a century before Shanawdithit set her maps to paper, when the Lenape leader Teedyuscung agreed to sell a parcel of land to the Penn family (of the then-colony of Pennsylvania) that was bounded by the distance that a man could walk in a day and a half. After the treaty was signed, the Penns' agent cleared a trail through the land and hired three of the fastest runners he knew to run along it, resulting in the Lenape ceding a swath of land twice as long as was initially envisioned. In response to the “fraud”—Teedyuscung's own characterization in his report to colonial officials—he subsequently, according to Lisa Brooks (Abenaki), “insisted on drawing his own map to delineate [the Lenape] territory and solidify their rights.”
Or, consider the end result of a seemingly innocuous encounter between Ac ko mok ki, a Siksika leader, and a surveyor for the Hudson Bay Company named Peter Fidler, which took place at an outpost just east of what is more commonly known today as Alberta. At the time, however, the outpost represented the frontier of colonial knowledge as well as settlement. When asked by Fidler about what lay further north and west, Ac ko mok ki traced in the snow—from memory—a map of more than 200,000 square miles of the continent, narrating the features of the map as he drew. Fidler then copied the map onto paper “reduced ¼ from the original,” annotated it with the information he'd heard Ac ko mok ki speak aloud, and then sent the map back to the headquarters of the Hudson Bay Company in London. Ac ko mok ki's knowledge was then incorporated into the map of the continent that the Hudson Bay Company had been preparing, and which three years later would be used by Meriwether Lewis and William Clark to determine the route for their expedition to the west coast. Their mission is widely recognized as authorizing the United States' future claims to the full width of the continent, and establishing the foundation for the idea of “manifest destiny” that would guide US territorial expansion into the next century and beyond.
!["An Indian Map of the Different Tribes that inhabit on the East & West Side of the Rocky Mountains with all the rivers & other remarkbl. places, also the number of Tents etc. Drawn by the Feathers or Ac ko mok ki -- a Black foot chief -- 7th Feby. 1801 -- reduced 1/4 from the Original Size -- by Peter Fidler." A sketch of the tribes which reside on the East and West sides of the Rocky Mountains. Each tribe is depicted as a circle on the map written next to a number, and a key in the top left corner describes the name of each numbered tribe with a corresponding number of tribe members [CHECK]. The left side of the map shows six lines that slope down and to the right, which the right-hand side imperfectly mirrors, meeting, assumedly, at the peak of the mountain. A horizontal divider between the key and the map stretches across the page, with various letters of the English alphabet marked along it, corresponding to another key on the bottom right corner of the map. Next to the key on the right are more circles and lines to indicate tribes that reside farther away from the central peak depicted. In the bottom left-hand corner, there is an annotation by Fidler that notes how many days it takes to travel between the numbered locations.](/images/shanawdithit/fidler-large-HBCA-E3-2-225.jpg)
For the Indigenous knowledge that they consistently capture, and the dispossession they continually leave in their wake, maps like the Hudson Bay Company's might be understood as weapons—weapons of map destruction, to adapt a phrase from Cathy O'Neil. For they become tools to dismantle Indigenous sovereignty just as effectively as they consolidate the knowledge on which colonial power depends.
These maps do not only record features of the landscape; they also serve as the source of stories that nations require to continue to grow. At the very same time that Shanawdithit was committing the story of the destruction of her people to paper, for example, a settler woman by the name of Emma Hart Willard was mapping a new narrative for the young United States. The Connecticut-born Willard, an educator and activist, designed her maps to accompany her US history textbook, History of the United States, or The Republic of America, which was first published in 1828—the year that Shanawdithit began her captivity—and would go on to be reprinted every year until the 1860s, when the US Civil War would require wholesale revision to the nation's origin story, as the next chapter explores.
From Willard's "First Map or Map of 1578""First Map or Map of 1578" , which depicts the routes taken by European explorers—including John Cabot to Newfoundland—to the "Second Map or Map of 1620"Second Map or Map of 1620 , which depicts the colony of Virginia (along with an inset documenting the Pilgrims' landing at Plymouth Rock), and onto the final "Ninth Map or Map of 1826""Ninth Map or Map of 1826" , which depicts the then-present day, Willard presents a “cumulative statement of nationhood,” as historian Susan Schulten explains, one which enlists the consolidating power of the map in the service of a story of America's national emergence. As Willard herself explains, her maps connect otherwise isolated historical “facts” in history and as a result, “contribute[s] much… to the growth of wholesome national feeling.”
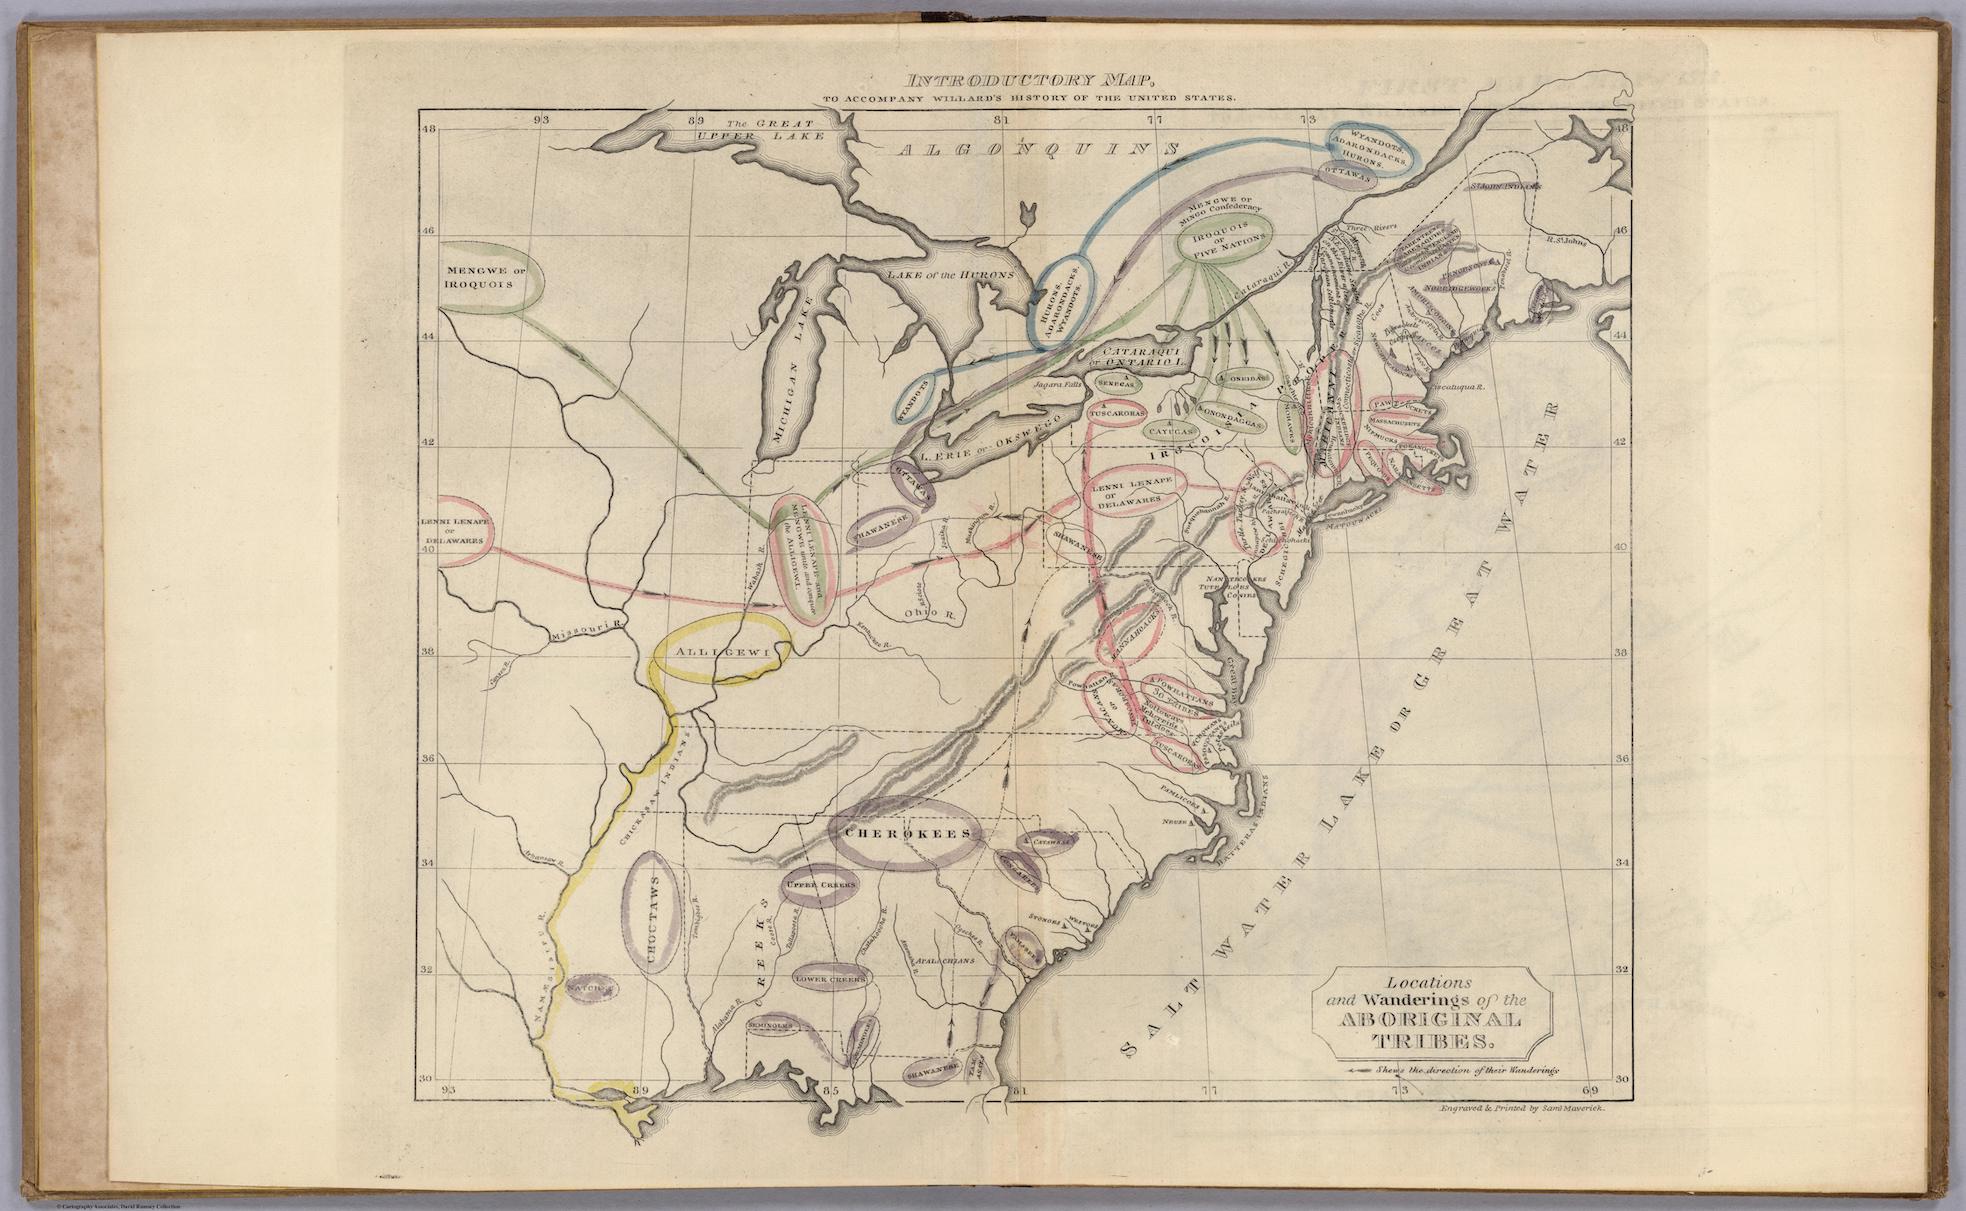
In this context, it is notable that the only map in the textbook that references Indigenous peoples or nations is the Introductory Map, which is subtitled Locations and Wanderings of the Aboriginal Tribes.
On this map, Willard places labels in the approximate locations of each Indigenous nation or tribe that she knew.
She also circles each of the tribe's names, with the size of the circle indicating its “size and relative influence.”
The color of the circles and the lines connecting them indicate affiliation and “migration,” in Willard's terms, although a more accurate word would be displacement.
The perspective inhabited by the “Introductory Map” is somewhat contradictory. Willard makes the clear choice to label certain geographic features with names intended to evoke an Indigenous worldview, as evidenced by how the same features are labeled differently on all subsequent maps.
Instead of the Atlantic Ocean, for example, the body of water is here labeled “Salt water Lake or Great Water,” which she explains in the accompanying chapter of the textbook are two names given to it by the Delaware at various times.
Yet Willard also chooses to present this map as “introductory,” rather than accord it the position of “First Map.” This she reserves for the map depicting the voyages of the European explorers, as previously discussed. More pointedly, Willard also fails to incorporate any of the Indigenous nations she marks here into the rest of the story she tells about the emergence of the United States. This choice “reinforced the [then] contemporary assumption that Native Americans existed in a timeless space prior to human history,” Schulten explains. Nations such as the Beothuk are not granted a place in the future of North America, only its past.
This view is confirmed in when considering Willard's map as an example of the “thematic map” genre. Such maps can be analyzed in terms of the layers of data that they visualize, and the designer's choices about how to order them. Because the data that is plotted as the bottom layer of the map is presumed to be stable and true--the “base data” over which new layers can be added, and through which new insight can emerge—it accords whatever dataset is placed at the bottom the status of incontrovertible fact, as historian and cartographer Bill Rankin has observed. In the case of “Locations and Wanderings of the Aboriginal Tribes,” Willard places the state borders of the not-yet-actually-extant United States in the background of the map, presenting them as the literal ground truth on which Native peoples are only temporarily superimposed.
With our eyes attuned to the layers of Willard's map and the claims implied by each, it is worth returning to Shanawdithit's maps once more in order to consider the parallel claims implied by its "kin-space-time lens,” to return to Harjo's phrase. In rejecting the distinction between foreground and background, and by presenting people, place, and time in a single visual plane, Shanawdithit insists on her cultural as well as geographic authority. By contrast to Willard, who strategically deploys temporal data in order to impose her own story onto the land, Shanawdithit employs time to unify the many stories that connect people to the land, across past, present, and future. Viewing her map from a settler perspective, and at more than two centuries removed, we—the authors of this chapter--cannot know the exact stories that order those relations. But we can recognize the additional stories that order the relations between the map and ourselves today. These are signaled by Cormack's annotations, and point to the relations between colonizer and colonized, and between knowledge and knower. These are not “good relations,” but they are necessary to acknowledge and to understand, because these relations—to recall the words of Mishauna Goeman that began this section—are those that “continue to mark us today.”
About a decade after Shanawdithit set her maps to paper, just over a thousand miles to the west, two men, likely Ojibwe, stood atop a ridge between Lake Huron and the Ottawa River. They were a day ahead of the rest of their group, and wanted to inform those behind them of the progress of their trip thus far, and their future route. One or both of the men etched a kikaigon, or directional map, into a piece of birch bark and attached it to a tree. The map depicts their path across Lake Huron, including the location of the campsite where they had spent the night, as well as the canoe they were using to travel. Two vertical lines drawn inside the canoe, each attached to an oar, represent the men themselves. The map suggests that they planned to continue up the Ottawa River, perhaps all the way to Montreal, another 400 miles away.
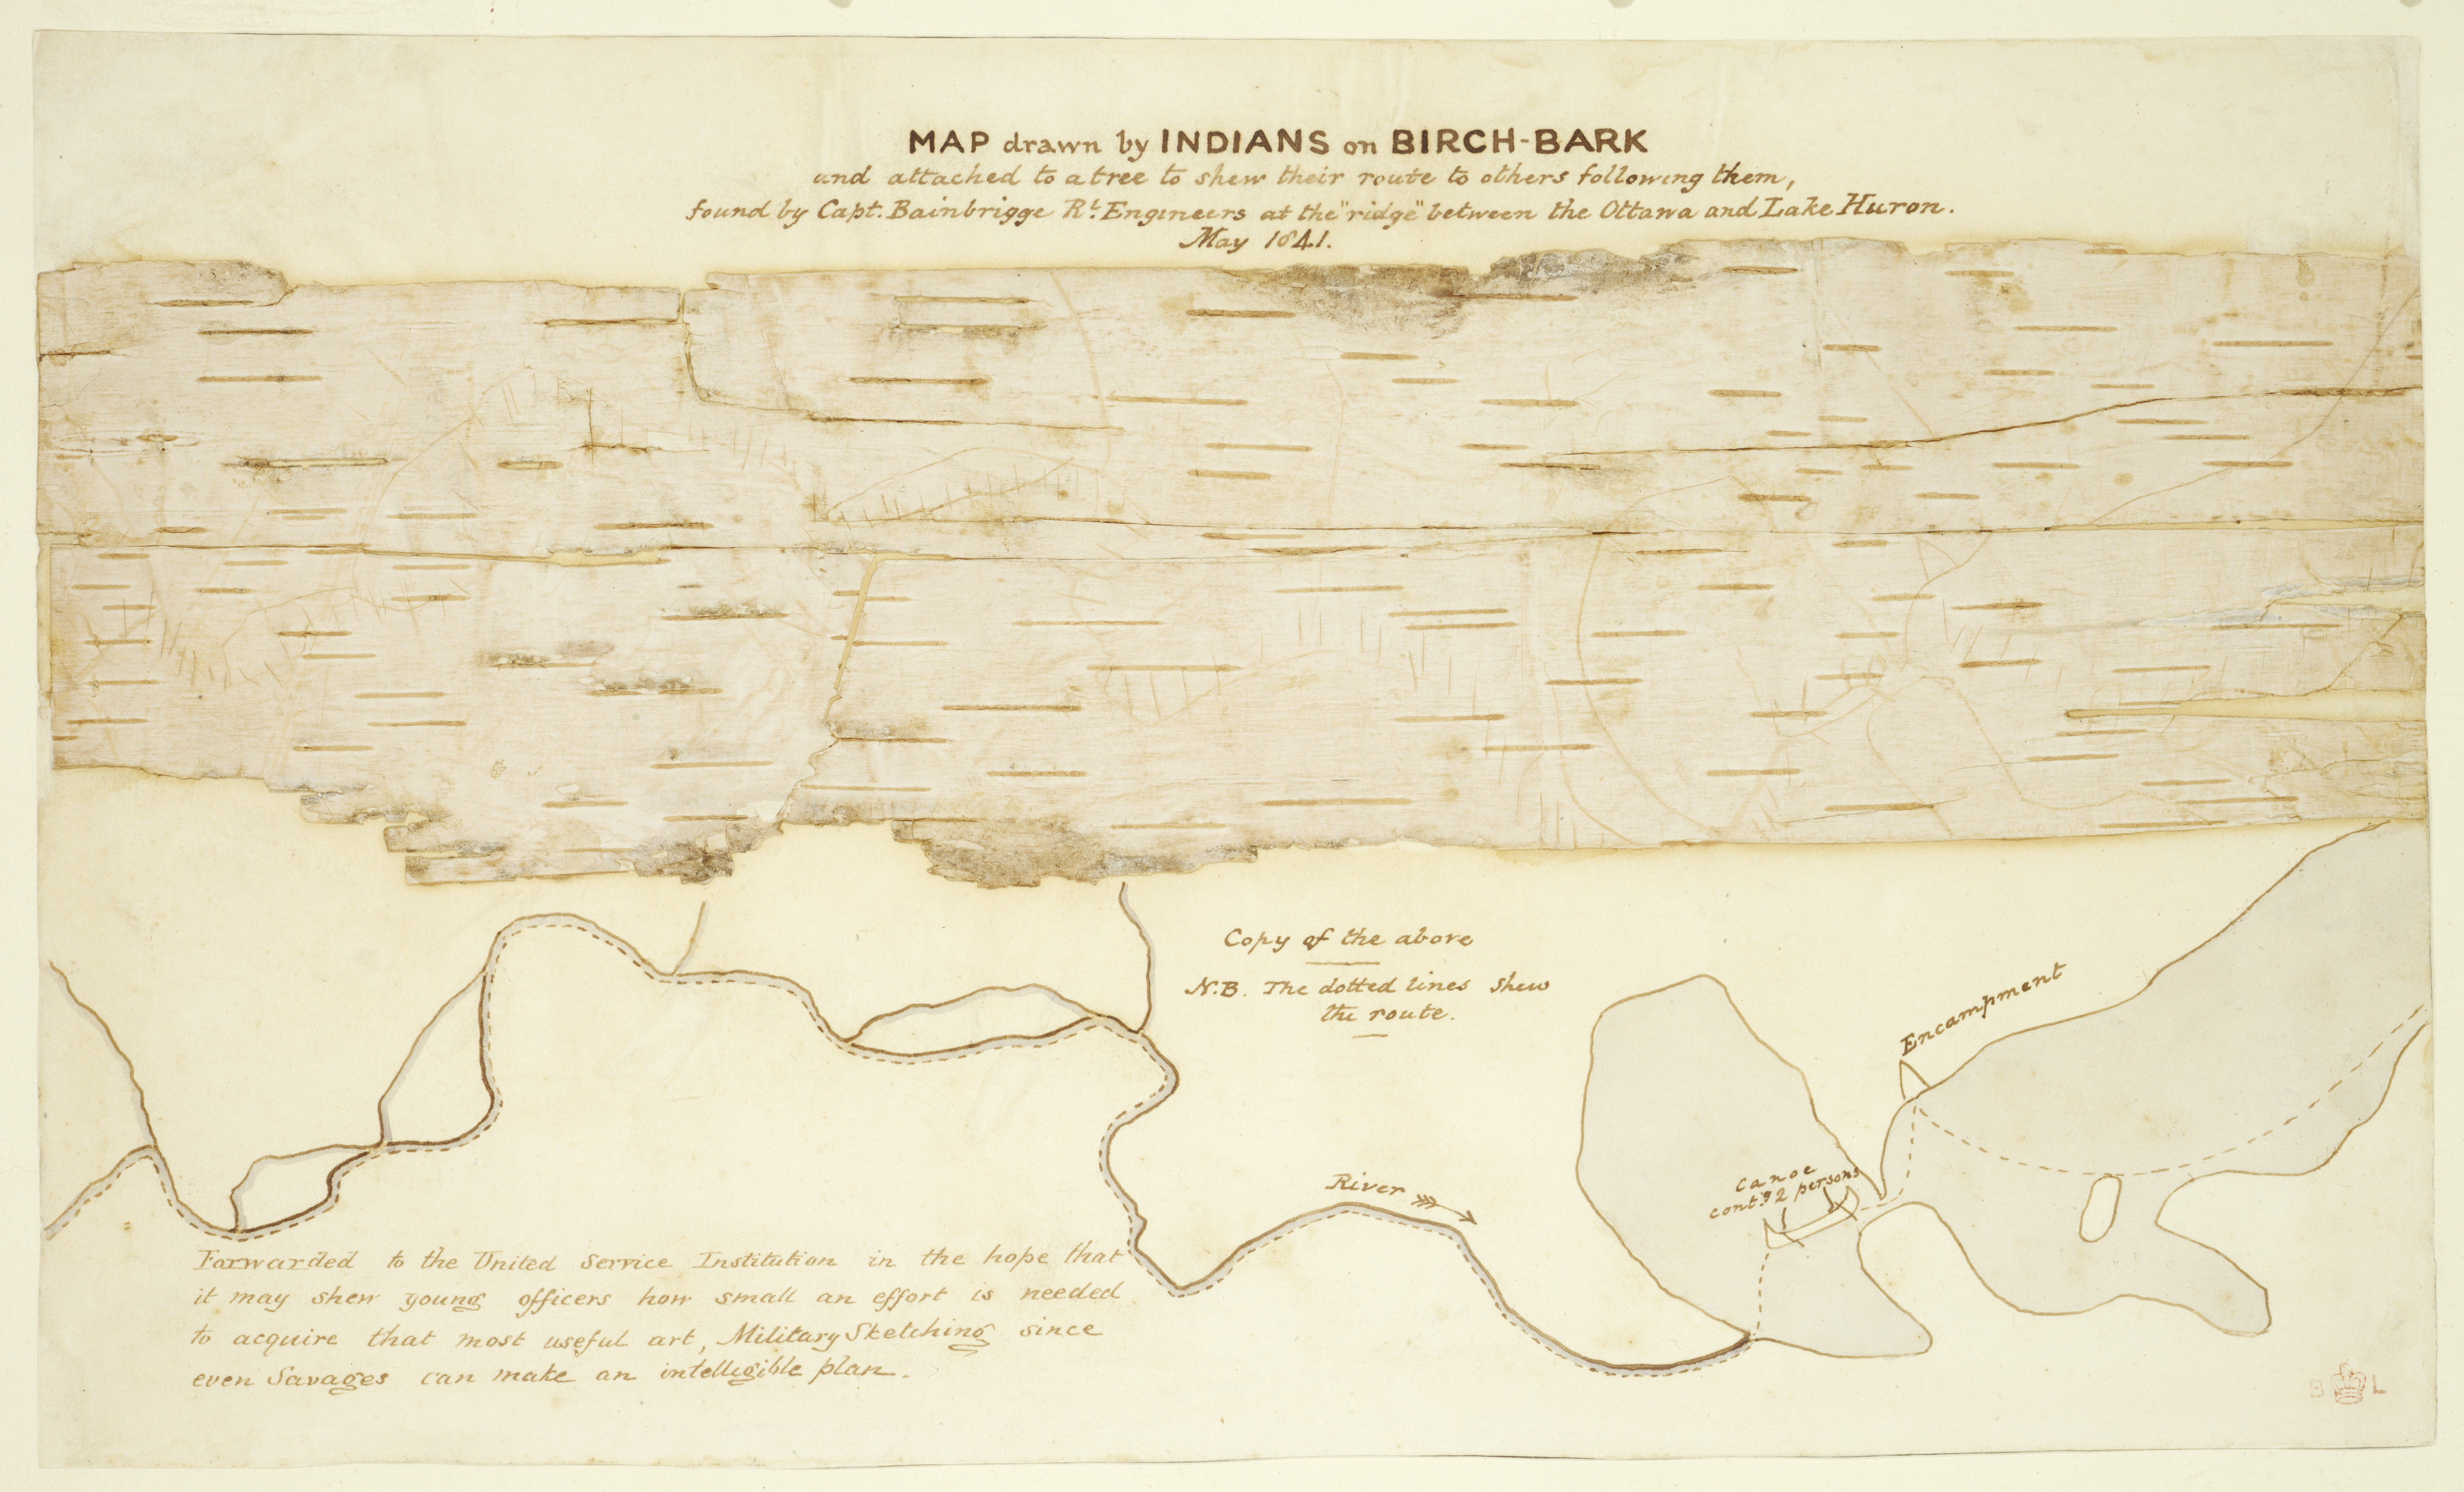
We do not know whether the other members of the group ever saw the map. We do know, however, that it was seen by one Captain Bainbrigge, of the Royal Engineers. We know this because Bainbrigge took the map off the tree and affixed it to a larger sheet of rag paper. Below the original, he drew his own copy of the map, replacing the vertical hash marks used to indicate the men's route with more constrained dotted lines, but keeping the icons used to indicate the camp, the canoe, and the men. He added in an indication of direction of the river and several other annotations, as well as a pejorative note. He then sent the map back to England, where it eventually arrived at the British Library. As a result, it has earned distinction as the oldest known example of a birch bark map to have been preserved.
Yet Bainbrigge's preservation of the map flattens it profoundly—and not only in a literal sense. By removing it from the time, place, and people for whom its insights were intended, Bainbrigge removes much of its meaning. His annotations, even more than Cormack's, impose his own assessment of its value. And because the original map and Banbrigge's copy are literally on the same page, this assessment is impossible for contemporary viewers to ignore. Put another way, we can no longer employ the map to produce the full range of insights for which it was initially designed. Its primary insights, now, have to do with the inescapability of its colonial frame.
But contemporary artist, Sarah Sense (Chitimacha/Choctaw), demonstrates how these current insights can be contested and further transformed. In her digital artwork, “Birch Bark,” she employs her own ancestral basket weaving techniques as a way to interrupt the unidirectional process of knowledge extraction that the Banbrigge map records. Her own process “re-Indigenizes” the map, as she explains in the accompanying artist's statement, redirecting some of the map's meaning-making force. Here, the “warp” of the image—what in basket-weaving practice is viewed as the more passive layer, since it serves as the basket's base—is a reproduction of the Banbrigge map. Woven through the map, in patterns derived from Sense's own Chitimacha and Choctaw heritage, is a photograph of the land. Considered as a thematic map, Sense's choice to make the land the more active “weft” controlling the pattern that is produced contests the authority of the map that serves as its base.
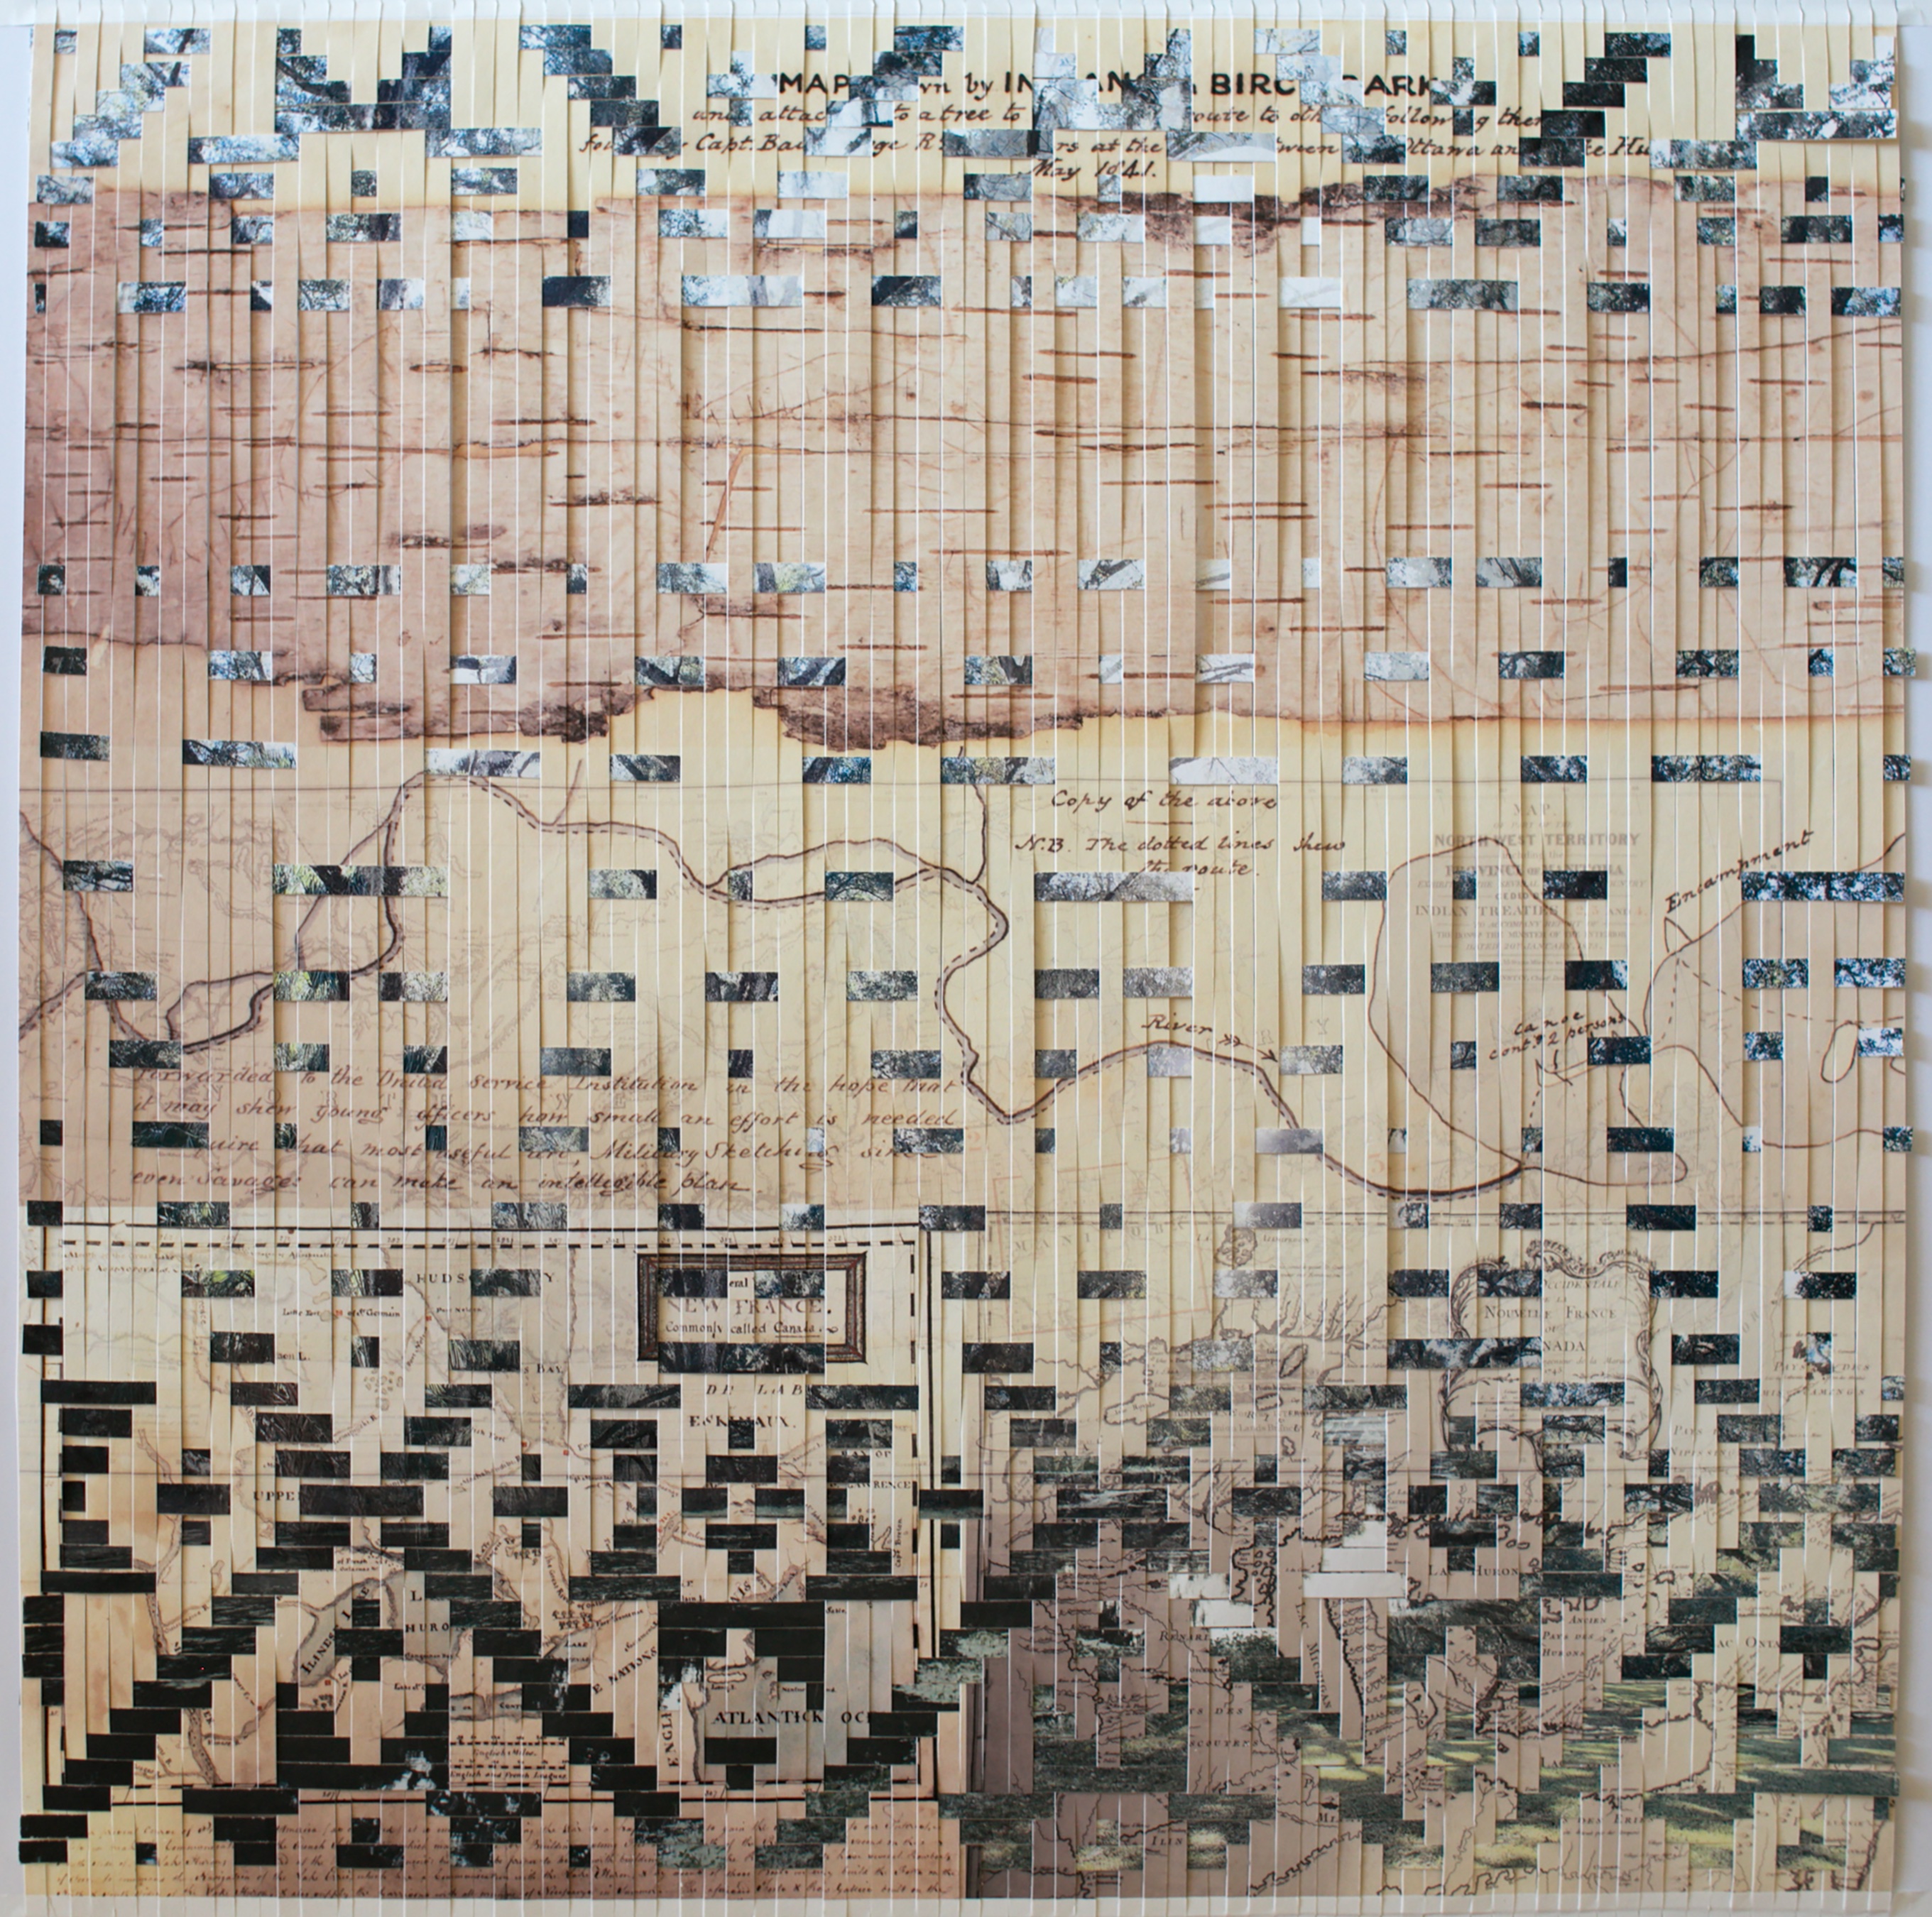
Our project team returned to Sense's image multiple times when considering how we might similarly infuse Shanawdithit's map with new meaning. But ultimately, we recalled the lessons of this chapter, reminding ourselves that Shanawdithit's map and the knowledge it records was not ours to further dissect. Our own knowledge is, after all, the knowledge recorded in the colonial archive. With this in mind, we turned away from the information inscribed in the map—information which we might otherwise convert into data and, for example, re-visualize on a more familiar map—and back towards the information in the archive that set the story that we tell here in motion. We asked ourselves how we might employ our perspective, and our skills, to contest the authority of the archive from within.
One particular passage seemed to hold the key to this work. It is a lengthy footnote that appears in Peyton's narrative, which reads in its entirety:
Mr. Peyton afterwards learned from the woman Shanawdithit, the full particulars of the manner in which his boat was stolen. She was present all the time and knew every incident connected with this event. As Mr. P. rightly conjectured, it appears the Indians were watching all his movements very closely. There was a high wooded ridge behind his house, which from its peculiar outline had been named Canoe Hill. It bore some resemblance to a canoe turned bottom up. One tall birch tree on the summit of this ridge, (still standing at the time of my first visit 1871), was pointed out by Shanawdithit as the lookout from whence the Indians observed Peyton's movements, during several days preceding the depredation. She also informed him, that when he paid his last visit of inspection to the long wharf before the taking of the boat, that the Indians were actually hidden in their canoe beneath the wharf, but kept so perfectly motionless, that in the dense darkness he did not observe their presence.Howley 96
Here in this footnote, perhaps even deliberately relegated to the bottom of the page, is the suggestion of a version of the events that contests the authority of Peyton's account. In this version, Shanawdithit serves as the authoritative source of knowledge, since she “was present all the time and knew every incident connected with this event.” Peyton, meanwhile, only learns “the full particulars” from Shanawdithit after that act.
We might additionally consider how, in Peyton's account, his surveillance of the Beothuk in advance of his own attack structures his entire narrative. Even as it contains details that stretch back decades, the narrative is titled “Capture of Mary March (Demasduit) on Red Indian Lake, in the month of March 1819.” But here is evidence of an earlier phase of surveillance, one far more sustained, in which the Beothuk “observed Peyton's movements” for “several days preceding the depredation.” In the account suggested by the footnote, it is the Beothuk—and not the British—who are in control.
The footnote also draws out a second theme. We have previously discussed how Shanawdithit's maps are mediated documents, inseparable from the colonial violence that produced them. But so too is Peyton's narrative. It was filtered not only through his eyes but through his memory, recorded late in his life, in 1871—nearly a half-century after the original events transpired—by none other than James Howley. It was then rewritten by Howley for the publication of his own book, The Beothucks or Red Indians , which was published by Cambridge University Press in 1915. Howley was likely the author of the footnote, and any additional edits he might have made to Peyton's version of the events—as he did to Shanawdithit's—will remain forever undisclosed.
John Paul's account, which we last considered in our analysis of the events depicted in Shanawdithit's map, was also recorded in the twentieth century, by an American anthropologist named Frank Speck, who published it in his own book on the Beothuk and Mi'kmaq in 1922. Speck's book, interestingly, also contains a series of photographs, which he took during his own visit to Newfoundland in the summer of 1914. One of these photographs is of a lookout tree.
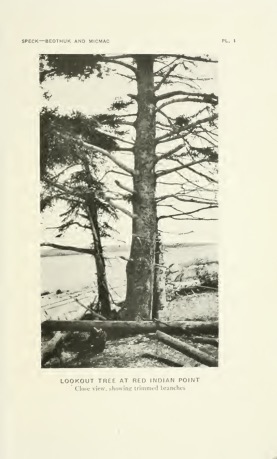
This lookout tree is not the same as the “tall birch tree” that Shanawdithit told Peyton about, as Speck labels it as being located at Red Indian Point. He also identifies it not as a birch but a “large white spruce,” as he describes in the textual account of his trip. Speck provides a second photo of the view from the top of the tree, which he “climbed to experience the sensation of observing these wastes [sic] from the vantage point of the ancients.” For Speck, the view from the lookout tree suggests a window in an unmediated past—a sense of what the Beothuk themselves might have seen.
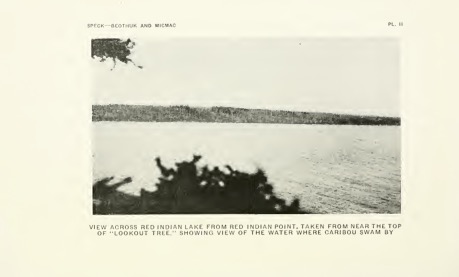
But what if we understood Speck's view from the lookout tree differently—in terms our distance from the past. Here, it is not the “vantage point of the ancients” that Speck hoped to document, but his own photograph that gives us meaning. Looking closely at the photo, we can see that the center of the image is clouded over, in contrast to the crispness of the ripples of the water that appear closer to the foreground of the image, in the lower right. This cloudiness, we contend, is this photo's greatest insight. In his photo, Speck indeed captures a view of the same lake that Shanawdithit saw, but he also captures the mediated nature of his own perspective.
One hundred years after Speck's visit to the Beothuk's winter camp, where the attack by the British took place, we can now employ sophisticated visualization tools in addition to digital photography in order to prompt fresh insights about the past. But these insights are also limited by our distance from the original events—as they are by the colonial archive and the historical evidence that it contains. Rather than view the limitations of what we can render visible with data as the end of our knowledge, however, we must each expand our own personal frame. When we consider our relationships with our sources and the people who created them, as well as the knowledge that, through our own work, we seek to enable, we come to see our responsibilities to them as well. This is the clarity that Speck's clouded image ultimately leads towards—more intentional and ethical design choices, a more precise sense of what we can or should seek to know, and what we must leave to others to explore.
Conceptual takeaways
- Consider your relationship to the data being visualized
- Consider your responsibility to the data and its stewards
- Be attentive to the distance between the data and your knowledge
- Remember that some knowledge is not yours to share
Practical takeaways
- Examine your relationships to your data and its stewards
- Take seriously and act on your responsibilities to them
- Consider how to keep your data more connected to its source
- Consider when your data might require additional or alternative protocols