Data by Design: An Interactive History of Data Visualization 1789-1900
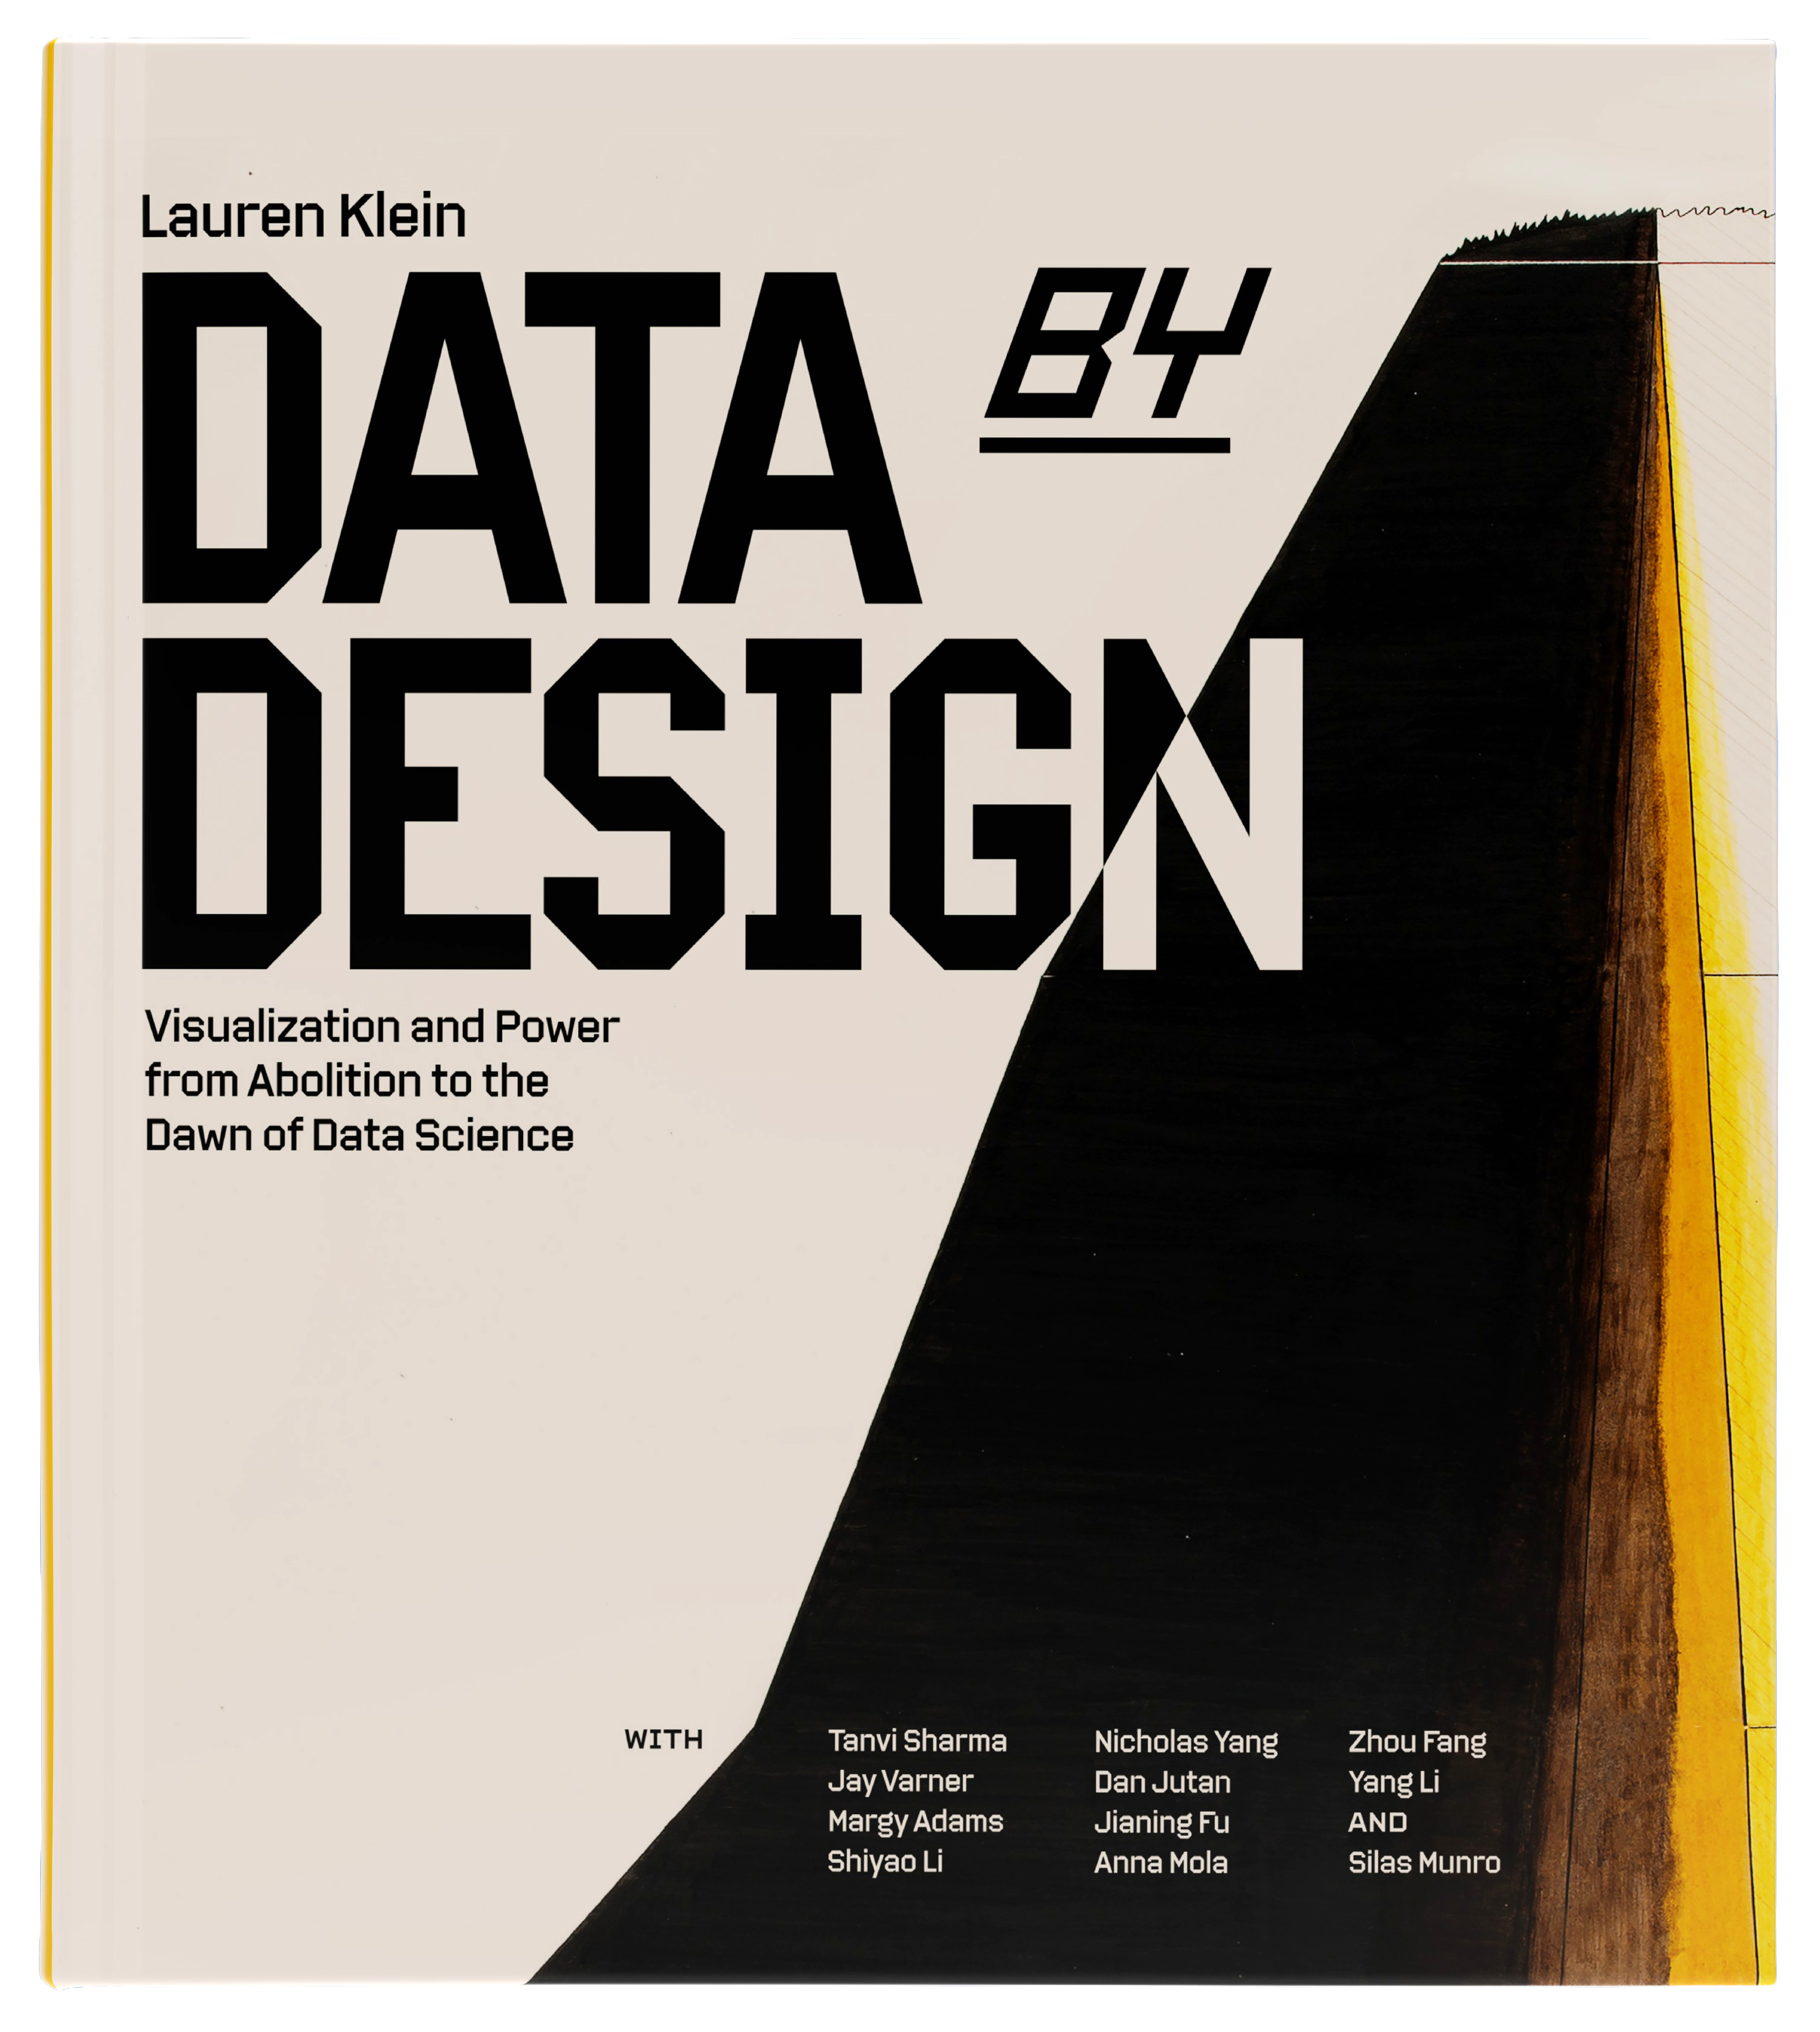
The history of data visualization holds the key to designing a more just future.
Out Now
From maps of colonial empires to charts of national trade, data visualization has long been used to consolidate knowledge and power. But just as often, it has been used to uncover oppression and bring about change. Data by Design journeys across continents and over centuries to expose the power of visualization—and to show how it can be wielded back.
A book for those who love charts and graphs, and for those who create them, Data by Design offers historical grounding, ethical clarity—and the inspiration we need—to envision a more just future.
Data
The Society for Effecting the Abolition of the Slave Trade and Responsible Visualization Design
Before there are data, there are people. How can the lives behind the data guide our visualization work?
Image
William Playfair and the Politics of the “Simple View
Visualization has never been neutral or objective. How can we learn to recognize the human decisions that shape each design?
People
Shanawdithit and our Place in the Colonial Frame
Maps, like all visualizations, tell stories. How can we learn to see the lines of power that they draw?
Knowledge
Elizabeth Palmer Peabody and the Idea of Epistemology
Visualization can produce knowledge in many ways. What ideas do we gain when we expand our view of the past?
Change
Lula Iola Mack, W.E.B. Du Bois, and the Path to Liberatory Data Visualization
Visualization can bear powerful witness to oppression. How can we use charts to make change in the world?
Labor
Data by Design and What We Learn from Visualization Work
Any visualization project is the work of many hands. How can we surface the significance of this labor?